AI-powered building energy analytics platform
#Industry&Energy #React #TypeScript #Redux #AIPlatform
Project definition
Location
Client
Project type
Industry
Service list
Front-end Development
Team size
M-Size (4–8 engineers)
Budget
$50,000 – $250,000
Task
The client, a company focused on enhancing building energy efficiency through AI, needed an advanced analytics module. The module had to enable users to generate custom reports based on selected environmental parameters over specified time ranges. The main challenge was to visually represent a large volume of data clearly and allow the export of these insights to external systems and report documents
Solution
We developed a multi-level chart module that aggregates data from various sensors with synchronized tooltips for easy cross-parameter analysis. Users can monitor multiple metrics on a single screen, improving data comprehension. The system supports exporting charts to PDF and CSV formats, preserving visual layout. This was achieved by creating a custom parser to transform SVG graphics into ReactPDF components, ensuring accuracy and stability in exported reports
Impact
The solution empowered users to efficiently analyze complex environmental data, leading to more informed decisions in energy management. The clear visualizations and export capabilities improved reporting accuracy and communication with stakeholders. This contributed to enhanced energy efficiency monitoring and optimization, supporting the client's goal to reduce energy consumption and operational costs significantly


💡 This is an AI-CORE project
💡 This is an AI-powered project
💡 Have a similar Industrial or Energy request?
💡 Have a similar Healthcare request?
💡 Have a similar EdTech request?
💡 Have a similar FinTech request?
💡 Have a similar request?
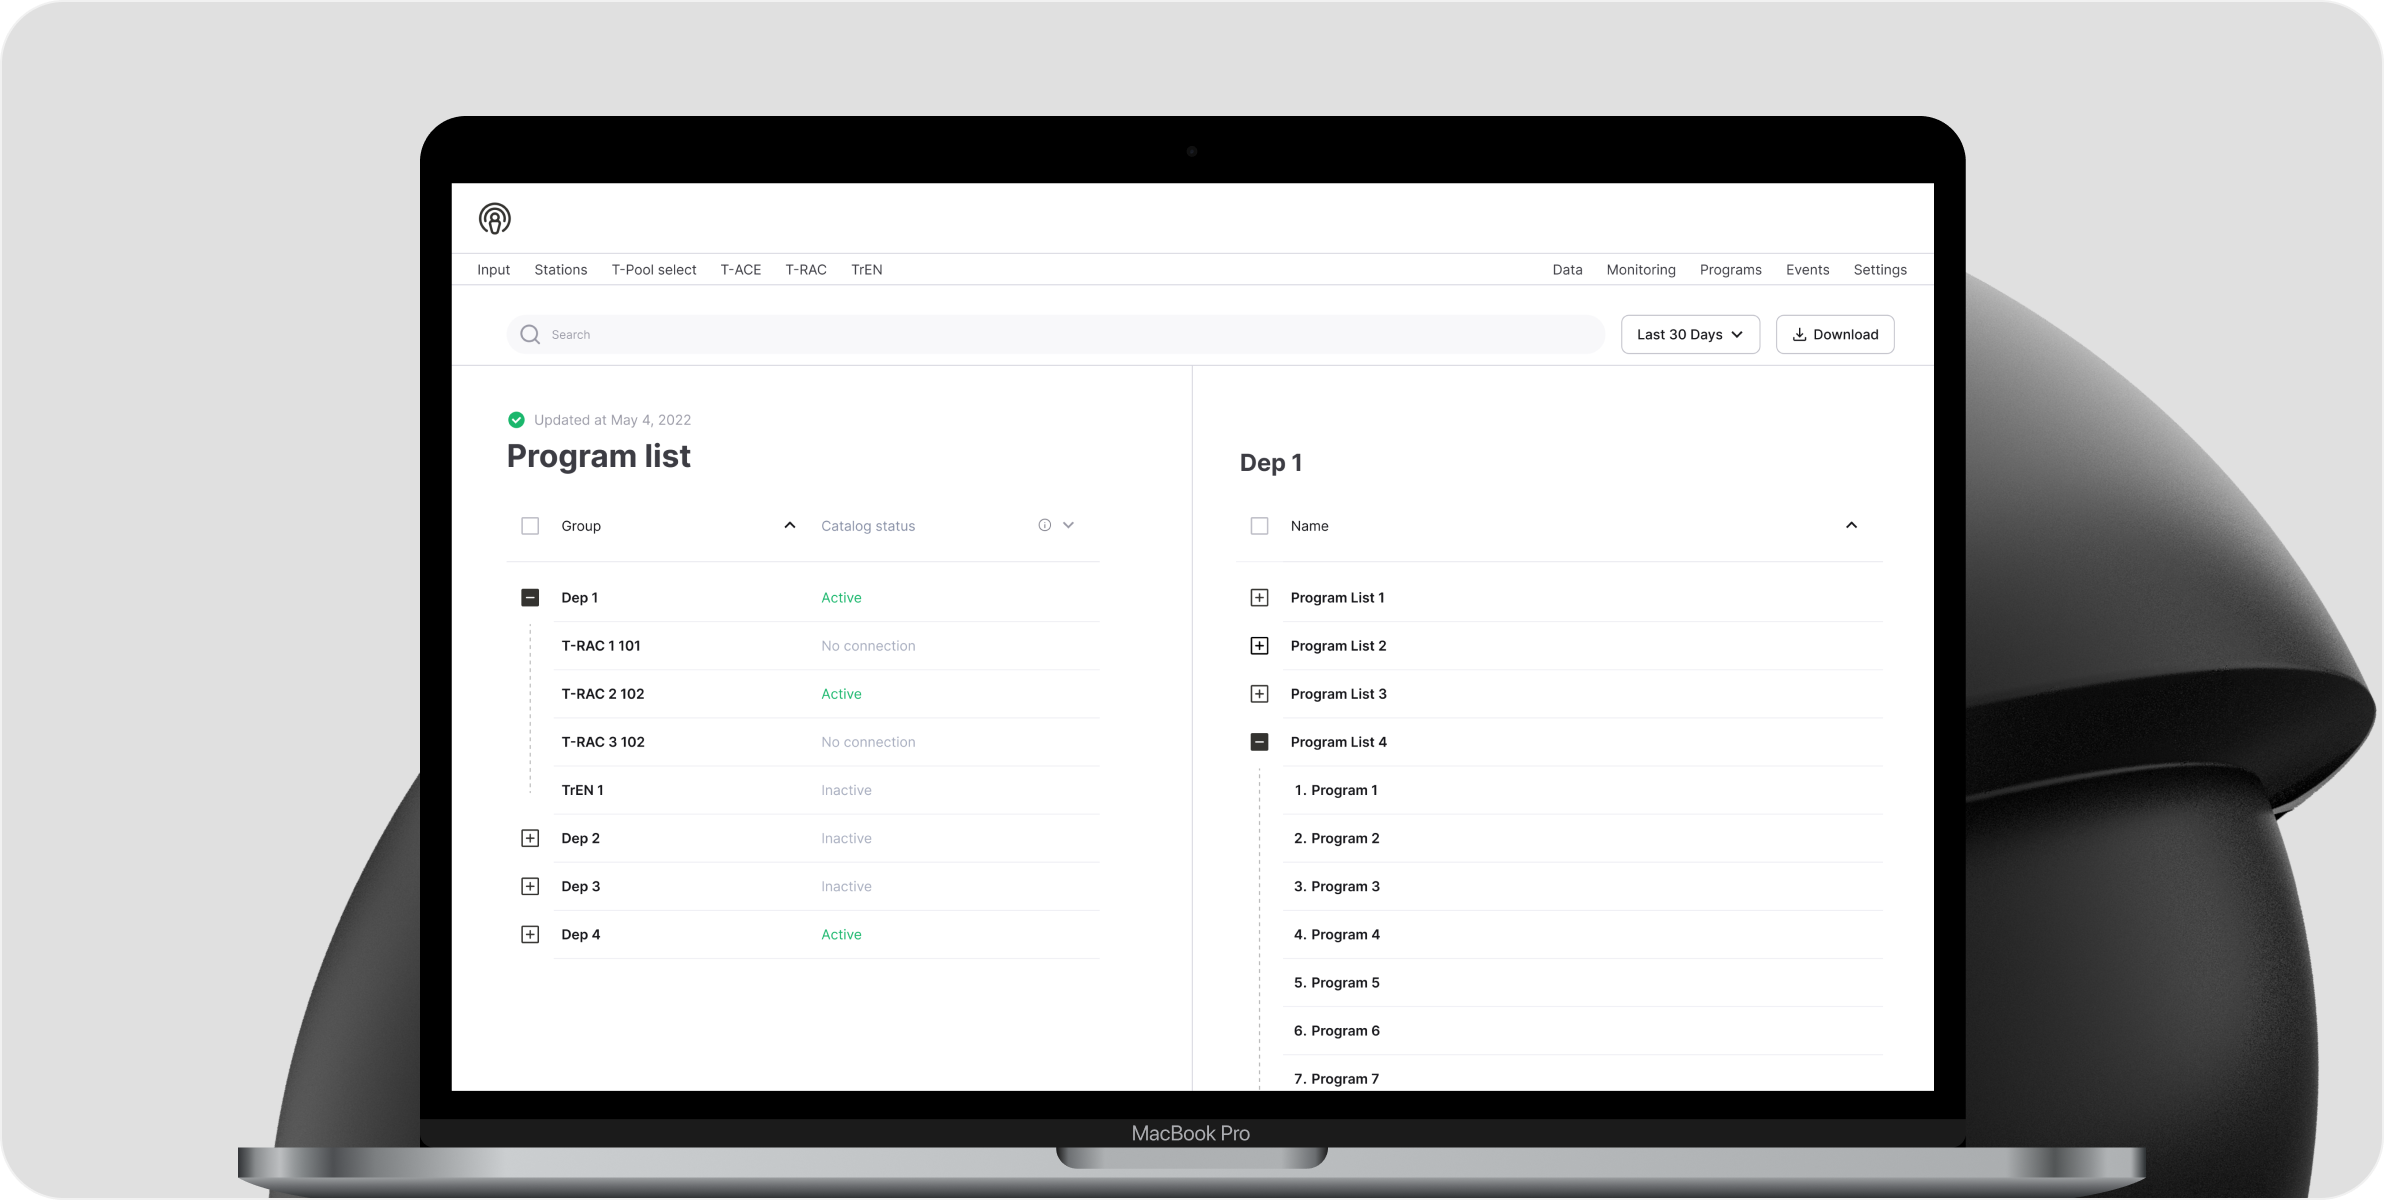
Advanced Analytics Module
We developed an advanced multi-level chart module that allows users to analyze multiple environmental parameters at once using synchronized tooltips for easy comparison
User Empowerment
Users gained the ability to generate customized reports tailored to specific parameters and time ranges, improving their ability to identify inefficiencies in building energy systems
Data Visualization Challenge Solved
Our solution successfully visualized large volumes of IoT sensor data, providing clear, actionable insights that enhance monitoring and decision-making
Development Process
The project involved building an advanced analytics module using React and TypeScript to visualize large volumes of IoT sensor data. We created multi-level charts with synchronized tooltips to display multiple environmental parameters on one screen. Export functionality to PDF and CSV was implemented using a custom parser to convert SVG graphics into ReactPDF components, ensuring accurate and stable report exports. This solution improved user data analysis and reporting capabilities
Technologies
AI-powered building energy analytics platform
Platform that leverages AI and IoT sensor data to provide advanced analytics and customizable reporting for building energy efficiency optimization
Book a call with our Head of Sales


